Restaurant sales are at a record, and most of their recent growth is price. The National Restaurant Association projects $1.55 trillion in restaurant and foodservice sales for 2026, up 4.8%, but only 1.3% after inflation (NRA 2026 report). Menu prices rose 3.5% in the year to September 2026 (BLS), and 42% of operators said their restaurant was not profitable in 2025 (NRA, February 2026).
Below are the numbers a prospective franchise owner should know, each with its source and year: spending, restaurant counts, revenue per location, demand shifts and operating costs. The last section turns them into questions for any healthy cafe brand, Clean Eatz included.
Key stats
- $1.55Tprojected US restaurant and foodservice sales, 2026 (National Restaurant Association)
- 627,086restaurants and other eating places with employees, 2025 average (BLS)
- 3.5%rise in restaurant menu prices, September 2025 to September 2026 (BLS)
- 42%operators who said their restaurant was not profitable in 2025 (NRA)
The short answer
The US restaurant industry is projected at $1.55 trillion in 2026 sales and counts about 627,000 restaurants with employees. Growth is mostly higher prices rather than more visits, about half of restaurants take in less than $1 million a year, and 42% of operators reported no profit in 2025.
Restaurant industry statistics at a glance
Ten numbers worth knowing
These restaurant industry statistics come from the National Restaurant Association (NRA), the Census Bureau, the Bureau of Labor Statistics (BLS) and USDA. Each covers a different slice of the trade.
| Figure | Period | Source | |
|---|---|---|---|
| Restaurant and foodservice sales | $1.55 trillion (projected) | 2026 | NRA |
| Real sales growth after inflation | 1.3% (projected) | 2026 | NRA |
| Food-away-from-home spending | $1.41 trillion | 2025 | USDA ERS |
| Restaurants and other eating places with employees | 627,086 | 2025 average | BLS QCEW |
| Average revenue, restaurants open all year | about $1.49 million | 2022 | Census |
| Restaurants open all year taking in under $1 million | about 51% | 2022 | Census |
| Menu price inflation, year over year | 3.5% | September 2026 | BLS CPI |
| Food services sales, year over year | 7.0% (advance) | September 2026 | Census |
| Food services and drinking places jobs | 12.39 million (preliminary) | September 2026 | BLS |
| Operators not profitable | 42% | 2025 | NRA |
Two checks keep restaurant statistics honest. Is a sales figure adjusted for inflation? In 2026 the gap is more than three points. Does a count cover every foodservice outlet or only restaurants with employees? The two differ by hundreds of thousands of locations.
Restaurant sales & the size of the industry
Big, still growing & mostly priced up
Restaurant sales are measured three ways: the NRA forecast, USDA spending data and the Census monthly survey. The NRA’s State of the Restaurant Industry report is the most cited, and its 2026 edition sets out the forecast below.
Annual food service sales
From the 2020 low to $1.55T
Restaurant and foodservice sales, $ billions
National Restaurant Association, 2026 State of the Restaurant Industry, p. 22. Includes restaurants, bars, schools, hospitals, hotels and retail food service.
Eating and drinking places account for $1.176 trillion of the 2026 projection: $576 billion at full-service restaurants, $557 billion at limited-service restaurants, which include fast casual, and $44 billion at bars (NRA). The rest is served in schools, hotels, stores and hospitals.
USDA counts the same market from the spending side. Food-away-from-home spending reached $1.41 trillion in 2025, against $1.10 trillion for food at home, so about 56% of US food dollars went to meals prepared outside the home (USDA ERS, June 2026, share calculated from its figures).
For the latest month, the Census advance report shows food services and drinking places selling $92.9 billion in September 2026, seasonally adjusted, 7.0% more than a year earlier (Census, October 15, 2026). Sales for the first nine months ran 4.4% ahead of 2025, before inflation.
How many restaurants are in the US
About 627,000 with a payroll
How many restaurants are in the US depends on what you count. The cleanest federal answer comes from the BLS Quarterly Census of Employment and Wages, which counts establishments with employees. It put the number of restaurants in US private industry, counted as restaurants and other eating places, at 627,086 in 2025, an annual average (BLS QCEW).
| Type (NAICS) | Establishments, 2025 | Change vs 2024 |
|---|---|---|
| Full-service restaurants (722511) | 264,800 | +0.2% |
| Limited-service restaurants (722513) | 269,945 | +1.2% |
| Snack and nonalcoholic beverage bars (722515) | 87,158 | +4.0% |
| Cafeterias, grill buffets and buffets (722514) | 5,182 | -0.3% |
| Restaurants and other eating places (7225) | 627,086 | +1.2% |
Add bars, caterers, food trucks and contract food services and the total reaches 721,796 (BLS QCEW). Wider still is the NRA’s “more than 1 million restaurant and foodservice outlets,” which counts school, hospital and workplace cafeterias.
Snack and nonalcoholic beverage bars, home to coffee, juice and smoothie shops, added locations fastest.
Average restaurant revenue
The average hides a wide spread
For revenue, the most recent complete count is the 2022 Economic Census. Restaurants and other eating places that operated all year took in $763.7 billion across 512,911 establishments, an average restaurant revenue of about $1.49 million (Census, calculated). By type: $1.68 million full service, $1.46 million limited service and $953,000 at snack and beverage bars.
Restaurants by annual revenue, 2022
Census Bureau, 2022 Economic Census, establishments by revenue size, NAICS 7225, establishments operated the entire year. Shares calculated from the counts.
A small group of very large locations pulls the average up. About 51% of restaurants open all year took in less than $1 million, so the typical one sits in the $500,000 to $999,999 band.
Treat any brand’s revenue claim the same way: ask for the median and the bottom of the range.
Restaurant industry trends to watch
Price, convenience & better-for-you food
Three restaurant industry trends show up in both government and trade data: guests paying more and hunting for value, meals leaving the building, and menus moving toward protein and cleaner recipes.
Restaurant menu prices & value seeking
Menus up 39% since 2019
| Consumer price index, 12 months to September 2026 | Change |
|---|---|
| All food away from home | 3.5% |
| Full-service meals and snacks | 3.8% |
| Limited-service meals and snacks | 3.2% |
| Food at home (groceries) | 1.8% |
| All items | 3.7% |
Restaurant menu prices are still rising faster than grocery prices: 3.5% against 1.8% over the 12 months to September 2026 (BLS, BLS food at home). The food-away-from-home index stood 39.3% above its September 2019 level, calculated from the same BLS series. USDA forecasts 3.5% for all of 2026 and 2.8% in 2027 (ERS, October 2026).
Guests notice. In the NRA’s consumer survey, 75% of recent limited-service customers said a discount or value promotion matters when they choose where to go, and 81% of delivery customers said the same (NRA 2026). Among limited-service operators whose food costs rose in 2025, 85% raised menu prices and 43% removed items.
Off-premises orders & grab-and-go
Nine in ten counter-service visits leave
Off-premises is now most of the limited-service business. Takeout, drive-thru and delivery made up 89.9% of limited-service customer traffic in 2025, up from 74.1% in 2019, according to Technomic data in the NRA report. Takeout alone was 43.6%, drive-thru 33.9% and delivery 12.4%. Operators still value the dining room, though. In 2025, 73% of limited-service operators said on-premises was the more successful part of their business, and 65% said building on-premises traffic will matter more in 2026. That favors a format with a counter for the visit and food built to travel.
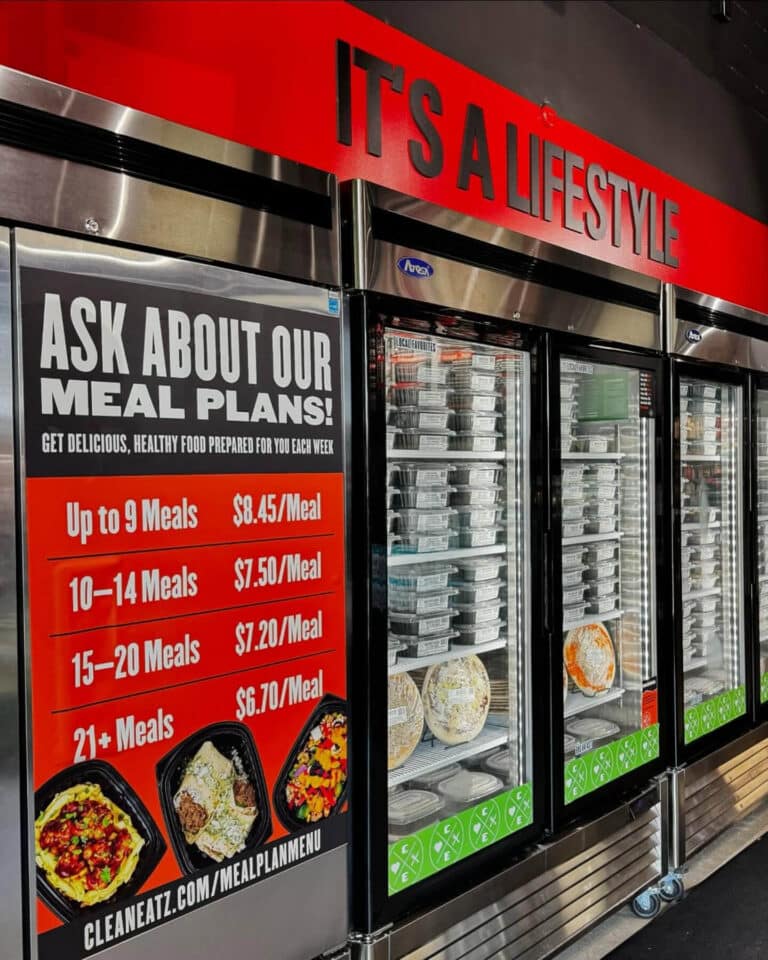
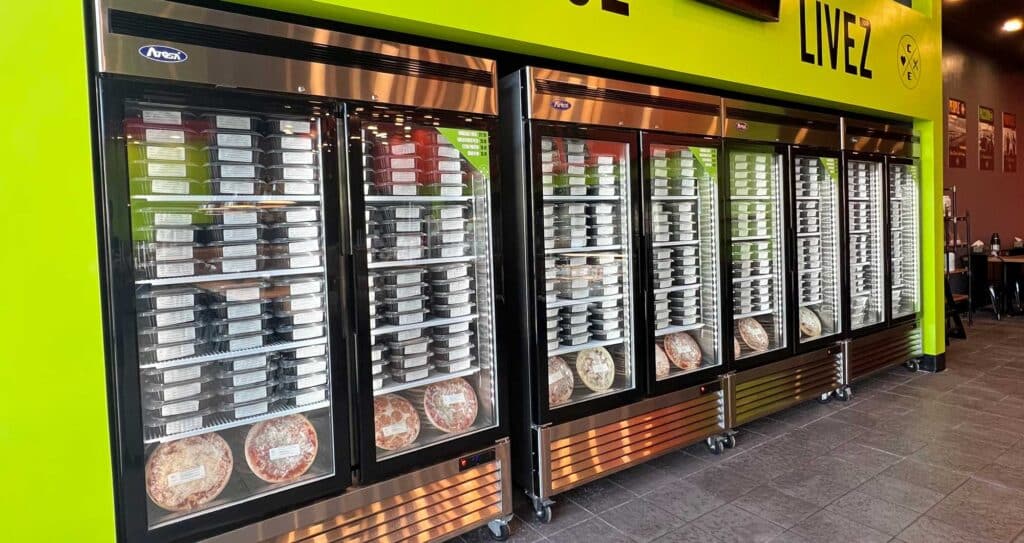
Grocery stores are competing for the same meal. FMI reported that the share of consumers choosing deli-prepared food in place of a restaurant meal reached 28% in 2025, up from 12% in 2017, with purchases peaking between noon and 5 p.m. (FMI, October 2025). Trade coverage of how healthy fast casual goes convenient follows the same shift through grab-and-go cases and weekly meal plans.
Better-for-you menus
Protein, labels & fewer additives
No federal series tracks healthy restaurant sales, so demand has to be read from signals. Four of the ten trends in the NRA’s 2026 What’s Hot culinary forecast point toward better-for-you eating: clear menu labeling and icons, allergen-friendly menus, cleaner recipes with fewer additives and dyes, and proteins as add-ons (NRA 2026). For 2026, 29% of limited-service operators planned to add smoothies and 24% wellness drinks.
Diners are changing too. In a KFF poll from November 2025, 12% of US adults said they were currently taking a GLP-1 drug such as Ozempic or Wegovy, and 18% said they had taken one at some point (KFF). Clean Eatz offers a GLP-1 Meal Plan Bundle of “macro-friendly, portion-controlled meals” aimed at that customer.
Disclosure is also a legal baseline. Federal rules require restaurants in a chain of 20 or more locations, operating under the same name with substantially the same menu, to post calories for standard menu items and provide fuller nutrition information on request (FDA).
Fast casual industry growth
Faster than the chain average
No government survey breaks out the fast casual industry. Census and BLS fold it into limited-service restaurants, and the NRA defines limited service as places where guests order at a counter, kiosk or online and pay before they eat (NRA). The best segment numbers come from Technomic’s Top 500 chain data, reported by trade press.
Fast casual restaurant industry statistics
Sales up 6% in 2025
Top 500 chains, 2025 change
Technomic data for the Top 500 chains, reported by Restaurant Business, April 24, 2026.
Key fast casual restaurant industry statistics for 2025: chain sales rose 6% to nearly $77 billion, slower than the segment’s average of nearly 9% over the prior three years, while units grew 5.1% (Restaurant Business, April 2026). Limited-service chains overall grew sales 3.1% to $361.5 billion, and quick-service chains 2.4%.
Growth was uneven. Sweetgreen’s total US sales rose 0.4% in 2025 despite 14% more units, a chain-wide total in the Technomic data rather than a same-store figure. On the America’s Favorite Chains podcast, Technomic’s Robert Byrne said fast casual is squeezed between casual dining and quick service on value: “Digital ordering just eradicated that edge that anybody might have.” For a healthy concept the lesson is price, since guests weigh a custom bowl against a casual-dining entree.
Federal data agrees on locations, with limited-service restaurants up 1.2% in 2025 against 0.2% for full service (BLS QCEW). Jobs differ: limited-service employment rose 0.9% in the year to August 2026 and full-service 1.6% (BLS, preliminary).
Brand news belongs next to this data, not in place of it. Clean Eatz, a healthy cafe brand, was covered by QSR magazine in July 2026, summarized in Clean Eatz strong quarter results.
Confirm any figure from press coverage in the franchise disclosure document.
Restaurant industry outlook for owners
Steady demand, thin margins
For 2026, the restaurant industry outlook is cautious. The NRA expects 1.3% real sales growth, and operators are split: 29% of limited-service operators expected higher sales in 2026, 27% expected lower sales and 44% about the same (NRA). Six in ten operators said business conditions got worse in 2025.
Margins were already thin. The NRA’s 2025 Restaurant Operations Data Abstract put median pretax income at 4.0% of sales for limited-service restaurants in 2024 and 2.8% for full service (NRA 2026 report).
At the 4.0% median, a limited-service restaurant keeps about $4,000 before taxes on every $100,000 of sales.
Costs, staffing & technology
What squeezes a restaurant P&L
| Share of limited-service operators calling it a significant challenge, 2025 (NRA) | Share |
|---|---|
| Food costs | 94% |
| Labor costs | 94% |
| Insurance costs | 89% |
| Credit and debit card processing | 82% |
| Energy or utilities | 79% |
| Recruiting and retaining employees | 63% |
Costs rose on every line. NRA data show food costs up 38% and labor costs up 35% since 2019 (NRA). Federal wage data shows the same pressure: average hourly earnings at food services and drinking places reached $22.17 in August 2026, preliminary, up 4.3% from $21.25 a year earlier (BLS).
Staffing has eased but not cleared. In late 2025, 47% of operators, including 43% in limited service, had job openings that were hard to fill, against 79% at the 2022 peak, and 65% of limited-service operators saw fewer applicants than usual for manager positions (NRA). About 22% of operators were short-staffed, and among short-staffed limited-service restaurants, 39% cut hours on days they were open. Food services and drinking places employed 12.39 million people in September 2026, preliminary (BLS).
Operators look to technology for relief. Among limited-service operators, 67% said it significantly changed on-premises ordering and payment and 60% their loyalty programs. About 26% of operators use AI tools, and only 6% said technology permanently eliminated jobs. On the guest side, 74% of adults would order and pay through a smartphone app if a nearby restaurant offered one (NRA).
Read the outlook as a range
Industry forecasts describe the average restaurant. No industry growth rate predicts the sales of any one location, which depend on site, operator and model.
What these numbers mean for healthy restaurant franchises
Turn the data into due diligence
For a buyer weighing healthy restaurant franchises, the data points to four tests. Growth that comes from price alone is fragile, so look for repeat visits. Limited-service traffic is 90% off-premises, so look for food designed to travel. Labor costs are up 35% since 2019, so look at hours and staffing. And about half of restaurants take in under $1 million, so look past any brand average to the full range.
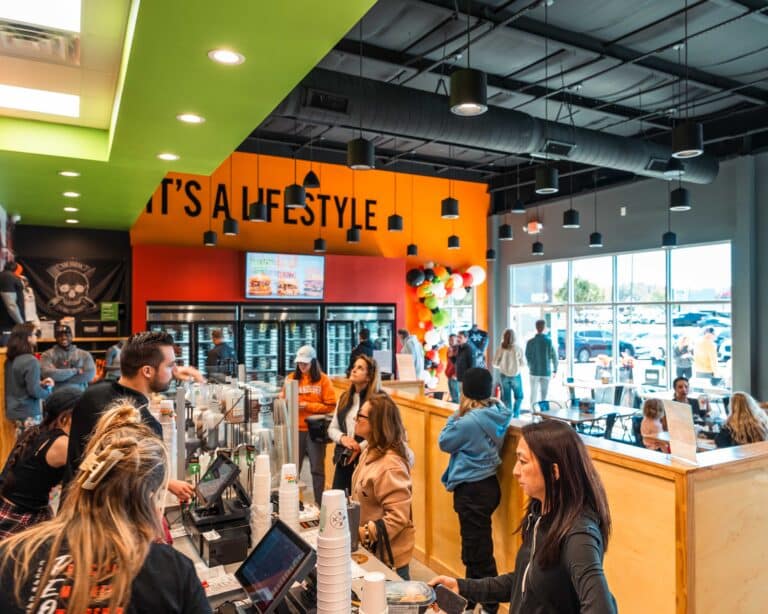
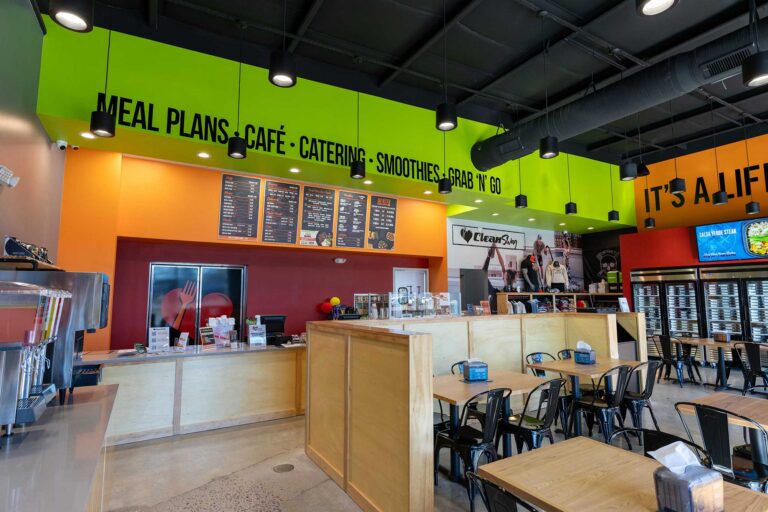
Clean Eatz is one worked example. It runs five revenue streams from one store (Meal Plans, Grab-N-Go Meals, In-Store Cafe, Retail and Catering), keeps roughly 11am to 7pm hours, has no fryers and fits in roughly 1,800 to 2,400 square feet. Its FDD reports results as a spread, not a single number.
- $962,325median gross revenues, 2025Clean Eatz Item 19, 92 franchised cafes
- $1,030,285average gross revenues, 2025Clean Eatz Item 19
- $389,339 to $2,053,793lowest to highest gross revenues, 2025Clean Eatz Item 19
Those are gross revenues, not owner income.
Clean Eatz reported them for 92 franchised cafes open at least 18 months as of December 31, 2025. Forty of the 92, or 43%, met or beat the average. Ask owners what separates a cafe near the bottom from one near the top.
*Financial performance representation. These figures are taken from Item 19 of the Clean Eatz Franchise Disclosure Document dated April 30, 2026, and reflect January 1 through December 31, 2025. They represent 92 franchised restaurants open at least eighteen months as of December 31, 2025 and operated by the same franchisee throughout the period. EBITDA is stated before owner and manager salary. These are historical results for existing locations. They are not a projection or guarantee of what you may earn. Your results may differ, and there is no assurance you will do as well. Written substantiation is available upon request. See Item 19 of the FDD for complete information.
Questions to bring to a discovery call
Ask about the data, not the pitch
- Menu prices rose 3.5% in the past year. How often have your cafes changed prices, and what happened to visits afterward?
- Off-premises is about 90% of limited-service traffic. How do meal plans, grab-and-go and catering show up in a typical week?
- Food and labor costs are up more than a third since 2019. Which costs moved most in your cafes in 2025, and what did owners change?
- Short-staffed restaurants cut hours. How do 11am to 7pm hours affect hiring, scheduling and manager retention?
- About half of US restaurants take in under $1 million. What does Item 19 show for the bottom quartile, and why do those cafes trail?
- Fast casual chain sales grew 6% in 2025. Which current owners can I call about their own market, chosen by me rather than by you?
Clean Eatz lists validation calls, which it calls “the most important step in the process,” among the steps to own a Clean Eatz, and says it does not screen who you speak with. Its research on healthy restaurant franchises page links the NRA report used here alongside other independent sources, so you can check the figures yourself.
Exploring costs nothing
Introductory calls, discovery conversations, reviewing the FDD, validation and Discovery Day cost nothing. Financial commitment comes only when you sign a franchise agreement.
Sources & methodology
Where every number comes from
Sales come from the NRA’s 2026 report (projections made in early 2026), USDA ERS spending data for 2025 and the Census advance retail report for September 2026, released October 15, 2026, which is preliminary. Restaurant counts are 2025 annual averages for private establishments with employees in the BLS Quarterly Census of Employment and Wages. The share of operators who were not profitable in 2025 is 42% in the NRA report body and press release, and 45% in the report’s CEO letter. Both describe all operators surveyed, and this page uses 42%.
Revenue figures are calculated from the 2022 Economic Census table of establishments by revenue size, NAICS 7225, for establishments open all year (Census data file), in 2022 dollars. Prices are BLS consumer price indexes, not seasonally adjusted, with no October 2025 reading because of the federal funding lapse. Fast casual figures are Technomic data for the 500 largest chains, reported by Restaurant Business. Figures marked as calculated were derived here. Clean Eatz figures are from Item 19 of its FDD dated April 30, 2026.
Sources
- 2026 State of the Restaurant Industry, National Restaurant Association, February 2026
- Persistent cost increases and enduring demand will shape the restaurant industry in 2026, NRA press release, February 12, 2026
- Food prices and spending, USDA Economic Research Service, updated June 1, 2026
- Food Price Outlook: summary findings, USDA Economic Research Service, October 23, 2026
- Advance monthly sales for retail and food services, September 2026 (release CB26-165), U.S. Census Bureau, October 15, 2026
- QCEW 2025 annual averages, NAICS 7225 restaurants and other eating places, BLS
- QCEW 2025 annual averages, NAICS 722511 full-service restaurants, BLS
- QCEW 2025 annual averages, NAICS 722513 limited-service restaurants, BLS
- QCEW 2025 annual averages, NAICS 722515 snack and nonalcoholic beverage bars, BLS
- QCEW 2025 annual averages, NAICS 722 food services and drinking places, BLS
- 2022 Economic Census, establishments by revenue size, U.S. Census Bureau
- 2022 Economic Census data file EC2200SIZEREVEST, U.S. Census Bureau, 2025
- CPI food away from home, BLS, 2019 to 2026
- CPI full-service meals and snacks, BLS, 2026
- CPI limited-service meals and snacks, BLS, 2026
- CPI food at home, BLS, 2026
- CPI all items, BLS, 2026
- All employees, food services and drinking places, BLS CES, 2026
- Average hourly earnings, food services and drinking places, BLS CES, 2025 to 2026
- All employees, limited-service restaurants, BLS CES, 2025 to 2026
- All employees, full-service restaurants, BLS CES, 2025 to 2026
- Fast-casual restaurant sales growth cooled in 2025 (Technomic data), Restaurant Business, April 24, 2026
- Study highlights grocery stores’ expanding role in convenient, affordable dining, FMI, October 7, 2025
- KFF Health Tracking Poll on GLP-1 use, KFF, November 14, 2025
- Menu labeling requirements, U.S. Food and Drug Administration
Restaurant statistics FAQ
Quick answers for buyers
How big is the restaurant industry?
About $1.55 trillion in US restaurant and foodservice sales for 2026, by the National Restaurant Association’s projection. Eating and drinking places account for $1.176 trillion of that, and USDA counted $1.41 trillion in food-away-from-home spending in 2025. BLS counted 627,086 restaurants and other eating places with employees in 2025.
Are restaurant sales still growing?
Yes, in dollars. Census data show food services and drinking places sales up 7.0% in September 2026 from a year earlier, an advance estimate, and up 4.4% over the first nine months. Much of that is price, since menu prices rose 3.5% over the same 12 months, and the NRA projects only 1.3% real growth for 2026.
Which restaurant segments are growing fastest?
Fast casual leads the chain data: Technomic reported 6% sales growth and 5.1% unit growth for fast casual chains in 2025, against 2.4% sales growth for quick service. By location count, snack and nonalcoholic beverage bars grew fastest in federal data, up 4.0% in 2025, followed by limited-service restaurants at 1.2%.