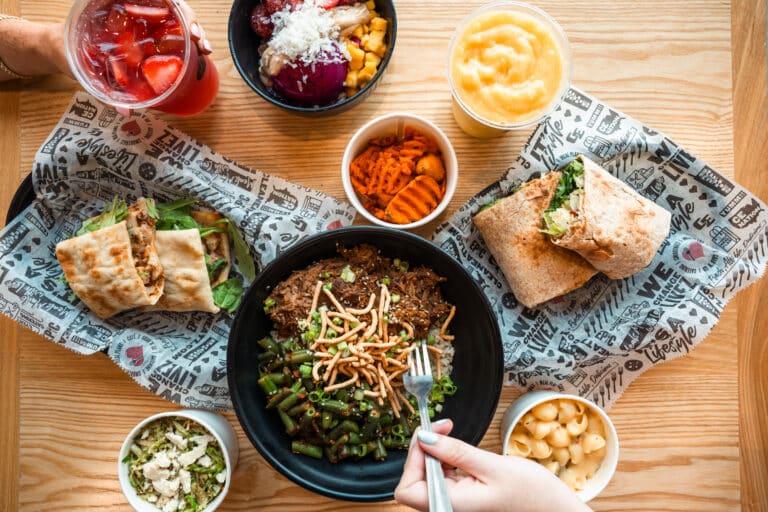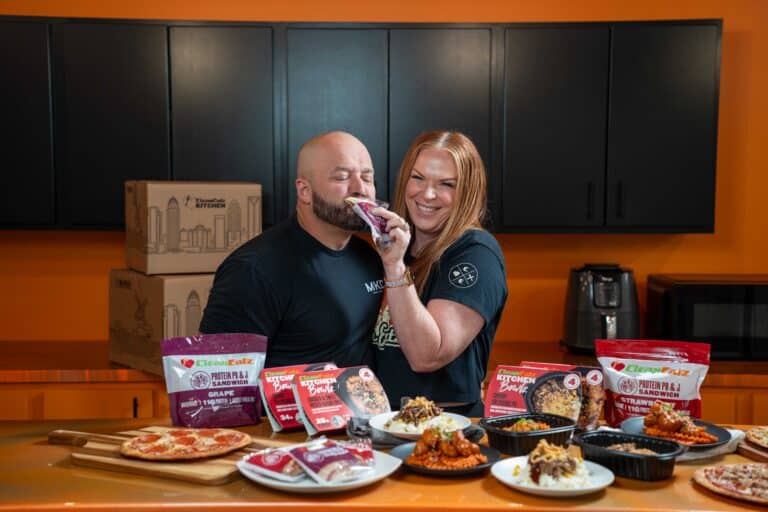
A healthy cafe owner needs about ten numbers, not fifty. Weekly gross sales, cost of goods sold, labor cost percentage, sales per labor hour and average ticket tell you whether the cafe is busy and run tightly. Meal plan repeat rate, grab-and-go sell-through, catering share and occupancy cost tell you whether the model is working. EBITDA before owner salary tells you what the cafe produces before your pay, debt service and taxes.
Each entry below gives the formula, how often to look and a benchmark from a source you can check, such as the National Restaurant Association’s 2024 operator data or the 2025 results of Chipotle and CAVA. Clean Eatz enters as the worked example, with its Item 19 cost lines in the FDD section near the end.
The short answer
Track weekly gross sales, cost of goods sold, labor cost percentage, sales per labor hour, average ticket, meal plan repeat rate, grab-and-go waste, catering share, occupancy cost and EBITDA before owner salary. Review sales and labor daily, the full set weekly and the P&L monthly.
Restaurant metrics that move cafe profit
Two jobs: run the day, judge the model
Restaurant KPIs fall into two groups. Operating restaurant metrics, such as sales, labor and food cost, move every day and respond to scheduling and ordering. Model metrics, such as meal plan retention, catering share and occupancy, move slowly and tell you whether the format fits your market.
The industry backdrop explains why the first group gets so much attention. The National Restaurant Association industry report for 2026 projects $1.55 trillion in sales but real growth of only 1.3%. In its 2024 operator data, the median limited-service restaurant kept 4.0% of sales as pretax income. At that margin, a two-point slip in food or labor cost erases half the profit.
The ten restaurant performance metrics below are ordered roughly by how often you should look at them:
| KPI | What it answers | Check it |
|---|---|---|
| Weekly gross sales | Is demand holding, by revenue stream? | Daily, reviewed weekly |
| Cost of goods sold % | Is ordering and portioning under control? | Weekly |
| Labor cost % | Is payroll in line with sales? | Weekly |
| Sales per labor hour | Is each scheduled hour earning its keep? | Daily |
| Average ticket | Are guests spending more, or are there fewer of them? | Weekly |
| Meal plan orders & repeat rate | Is recurring revenue growing? | Weekly |
| Grab-and-go sell-through & waste | Are freezer pars right? | Weekly |
| Catering share of sales | Is a lumpy channel carrying too much? | Monthly |
| Occupancy cost % | Is the lease affordable at current sales? | Monthly |
| EBITDA before owner salary | What is left before you, your manager and the lender? | Monthly |
Weekly gross sales
The number every fee is built on
Gross sales is the top line before any cost. Track it daily, but judge it weekly, because a single rainy Tuesday tells you little and a soft week tells you a lot. Compare each week with the same week last year, not with last week, so holidays and school calendars cancel out.
In a franchise the weekly view matters for a second reason: royalties are usually charged on gross sales. Clean Eatz charges a 6% royalty, processed weekly by automatic ACH, plus a 2% brand fund and at least 1% for local marketing. On every $100,000 of gross sales that is $6,000, $2,000 and at least $1,000, or at least $9,000 before the $638 monthly technology fee.
A single sales figure hides the mix. Split it by stream so you can see which one moved:
- Meal Plans (weekly pre-portioned orders)
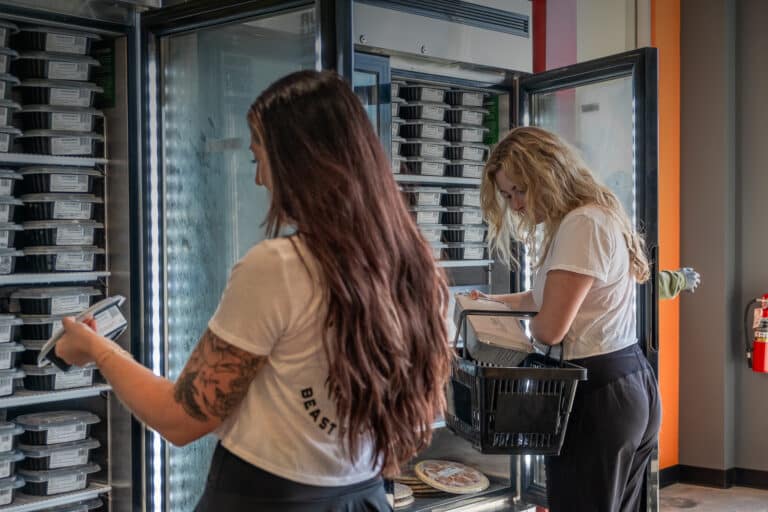
- Grab-N-Go Meals (frozen, from the freezers)
- In-Store Cafe (dine-in and carry-out)
- Retail (snacks, supplements and related products)
- Catering (event and office orders)
Read Item 19 the right way
Item 19 reports annual gross sales, not weekly ones, so the FDD will not hand you a weekly target. Ask owners in validation how much their weeks swing and which stream causes it.
Cost of goods sold as a share of sales
Food cost, plus everything else you resell
Cost of goods sold, or COGS, is what you paid for the food, packaging and products that left the building, divided by sales. The standard formula is beginning inventory plus purchases minus ending inventory. Without a real weekly count, the number is a guess.
- 32.4%Median food and beverage cost, limited-service restaurants, 2024National Restaurant Association
- 29.6%Food, beverage and packaging, Chipotle restaurants, 2025Chipotle annual results
- 29.8%Food, beverage and packaging, CAVA restaurants, 2025CAVA annual results
The NRA’s 2024 operator data puts the limited-service median at 32.4% of sales, against an average of about 33% in its 2010, 2013 and 2016 editions. Chipotle and CAVA ran 29.6% and 29.8% in 2025, but both buy at national scale, so treat their figures as a reference, not a target.
A cafe that also sells retail products will carry a broader COGS line than a restaurant’s food cost, because a protein bar bought for resale has its own cost and margin. Track COGS by stream if your point-of-sale and inventory systems allow it, so a shift toward retail is not mistaken for waste in the kitchen.
Labor cost percentage
Payroll divided by sales, every week
Labor cost percentage is total payroll, including payroll taxes and benefits, divided by sales for the same period. In the NRA’s 2024 data it is the line that most clearly separates the operators who made money from those who lost it.
Across more than 900 operators, the median labor cost was 31.7% of sales for limited-service restaurants and 36.5% for full-service in 2024, up from about 28% and 33% on average in the 2010, 2013 and 2016 editions. Split by result, the profitable limited-service operators had a median of 30.0%, and those that lost money 34.1%.
| Profitable operators | Operators with a loss | |
|---|---|---|
| Limited-service median labor cost, 2024 | 30.0% | 34.1% |
| Full-service median labor cost, 2024 | 34.2% | 42.9% |
Wages keep pushing the ratio up. BLS data show average hourly earnings at food services and drinking places of $22.17 in August 2026 (preliminary), against $21.25 a year earlier, a rise of about 4.3%. If prices do not rise as fast, the labor line grows as a share of sales.
Before you compare any two labor figures, ask what is inside them. Some reports include a salaried manager and some do not. The Clean Eatz FDD states EBITDA before owner and manager salary, which matters when you read its labor line in the FDD section below.
Sales per labor hour
Labor cost, measured shift by shift
Sales per labor hour divides sales by the hours worked in the same period. A Wednesday with 60 crew hours and $4,200 in sales runs at $70 an hour.
Unlike labor cost percentage, it can be read hour by hour, so it is the number to write next week’s schedule from.
Labor cost percentage and sales per labor hour are two views of the same thing. Divide your hourly labor cost by the labor percentage you want, and you get the sales each hour must produce.
| Labor cost share | Source of the ratio | Sales needed per labor hour at $22.17 |
|---|---|---|
| 25.1% | Chipotle restaurants, 2025 | $88.33 |
| 30.0% | NRA median, profitable limited-service, 2024 | $73.90 |
| 31.7% | NRA median, all limited-service, 2024 | $69.94 |
| 34.1% | NRA median, limited-service with a loss, 2024 | $65.01 |
The arithmetic uses the BLS average hourly earnings figure, which excludes payroll taxes and benefits, so your loaded hourly cost and the sales you need per hour will both be higher. Plug in your own wage rate.
Hours matter too. A Clean Eatz cafe runs roughly 11am to 7pm, so no slow late-evening shifts pull the average down, as its post on closing by 7 explains.
Average ticket
Sales equal guests times ticket
Average ticket, or average check, is sales divided by transactions. Read it only beside the transaction count.
A rising average ticket with falling transactions means fewer guests paying more, which is a pricing result, not a demand result. Two public chains show the split. In 2025 Chipotle’s comparable sales fell 1.7% as transactions dropped 2.9%, partly offset by a 1.2% rise in average check. CAVA’s same restaurant sales rose 4.0%, with 2.4% from menu price and product mix and 1.6% from guest traffic.
In a five-stream cafe, a blended average ticket hides more than it shows. A weekly meal plan order is one transaction that covers many meals, while a smoothie is one item. Report the average ticket by stream, and watch transaction count beside it.
Quarterly figures in press coverage, such as Strong Q1 results in QSR, are not Item 19 figures. Base any comparison on the FDD, and ask owners in validation how their own ticket and transaction counts have moved.
Meal plan orders & repeat rate
Recurring revenue, counted weekly
Meal plans are the closest thing a cafe has to a subscription, so measure them like one.
The brand’s Portrait of the regular guest describes the customer who keeps a standing weekly order and expects it ready on time. That customer shows up in the repeat rate long before the sales line, and an order that is not ready is the fastest way to lose them.
- Active orders: meal plan customers with an order this week.
- New orders: first-time meal plan customers this week.
- Repeat rate: customers who ordered last week and again this week, divided by last week’s customers.
- Four-week retention: customers active four weeks ago who are still active today.
None of the industry sources cited in this post publishes a meal plan retention benchmark. Ask current owners which of these counts they track and what a normal week looks like.
Grab-and-go sell-through & waste
Every unit stocked is sold or written off
Sell-through is units sold divided by units stocked over a period. Waste is the cost of units discarded, divided by the cost of units produced. Read the two together, because each one hides the other’s failure. High sell-through with frequent empty shelves means your pars are too low, and the sales you missed never show up anywhere. Low waste can mean the same thing. High waste with full shelves means you are producing for a demand that is not there.
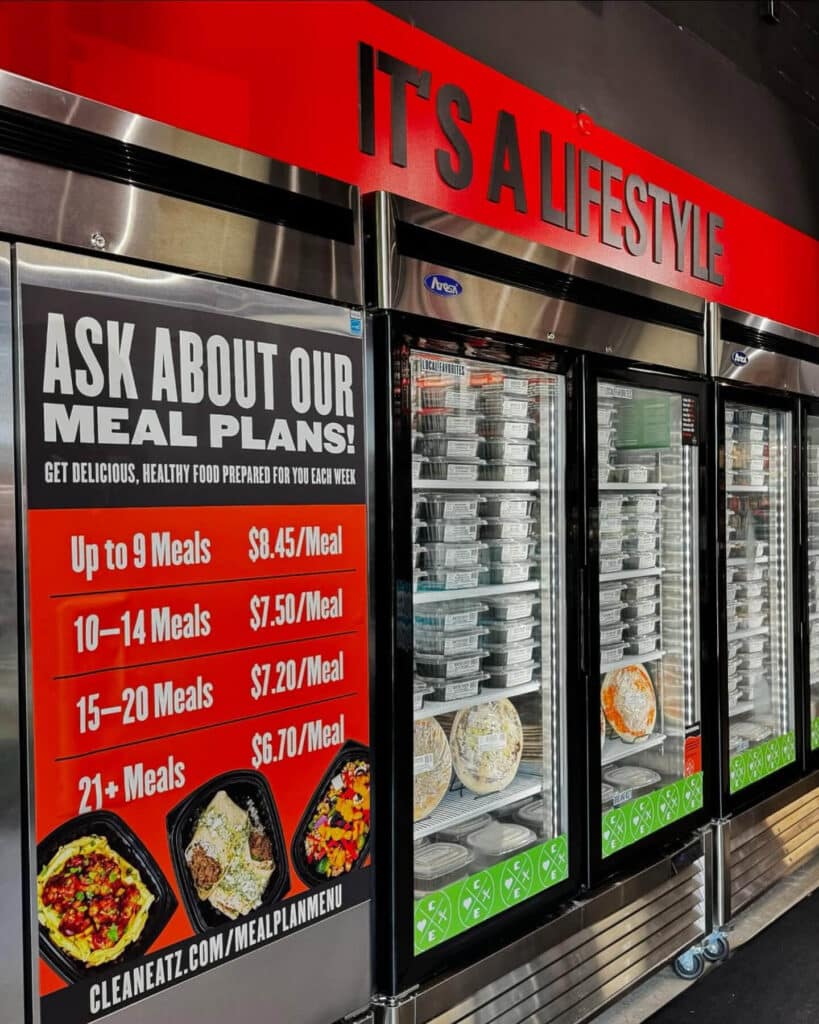
At Clean Eatz, Grab-N-Go Meals are frozen and sold from freezers. Shelf life gives you room, but it also lets slow items sit unnoticed.
- Count units stocked, sold and discarded by item each week
- Set a par level per item and review it monthly
- Flag any item that sells below half its par for two straight weeks
- Log every discard with a reason: date, damage or quality
- Compare waste cost with COGS so the two numbers reconcile
Catering share of sales
Useful revenue, but lumpy
Catering share is catering revenue divided by total gross sales. Catering orders are large and irregular, so a single office lunch can lift a week and its absence can sink the next one. Read this one monthly, and track the order count and repeat accounts alongside the dollars.
None of the industry sources cited in this post publishes a catering share benchmark, so treat any quoted industry average with caution.
At Clean Eatz, catering is one of the five revenue streams, positioned as “a fresh alternative to traditional event menus.” Ask owners how concentrated their catering accounts are. A share built on two clients is a risk, not a strength.
Occupancy cost as a share of sales
The cost you sign for before you open
Occupancy cost covers rent and the charges that come with the lease, divided by sales. It is the most fixed line on the P&L, so the percentage falls as sales rise and climbs fast when they drop. In 2025, occupancy ran 5.2% of revenue at Chipotle and 7.1% at CAVA.
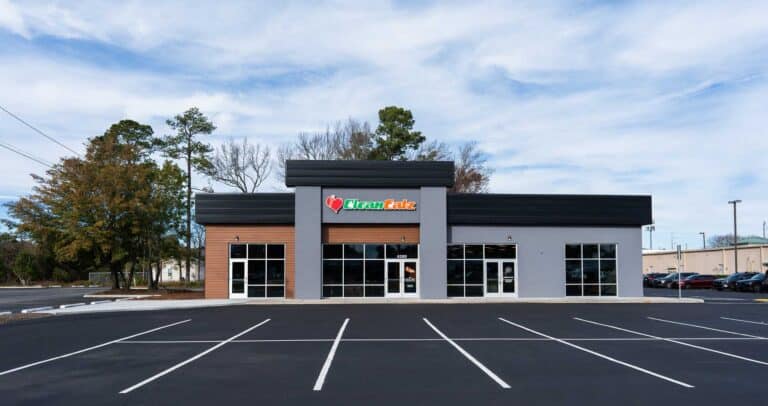
Most of this KPI is decided before opening, when you sign the lease. A smaller footprint helps. A Clean Eatz cafe runs roughly 1,800 to 2,400 square feet, and Item 7 estimates $2,500 to $18,000 for rent or real estate before opening.
Read the whole lease
Common area charges, property tax and insurance pass-throughs, and scheduled rent increases all land in occupancy. Have your attorney read the lease before you sign it.
EBITDA before owner salary
What is left before you get paid
EBITDA is earnings before interest, taxes, depreciation and amortization. Some franchise disclosures, including Clean Eatz’s, also state it before the owner’s pay. That makes it a measure of the cafe’s operating result, not of the owner’s income.
Clean Eatz reports average EBITDA of $128,312 in 2025 across 92 franchised cafes open at least 18 months, stated before owner and manager salary and before debt service, depreciation and taxes. That is 12.5% of the $1,030,285 average gross revenues. Neither figure is owner income.
*Financial performance representation. These figures are taken from Item 19 of the Clean Eatz Franchise Disclosure Document dated April 30, 2026, and reflect January 1 through December 31, 2025. They represent 92 franchised restaurants open at least eighteen months as of December 31, 2025 and operated by the same franchisee throughout the period. EBITDA is stated before owner and manager salary. These are historical results for existing locations. They are not a projection or guarantee of what you may earn. Your results may differ, and there is no assurance you will do as well. Written substantiation is available upon request. See Item 19 of the FDD for complete information.
Before you compare this figure with anything, list what still has to come out of it:
- Owner and manager payThe Clean Eatz Item 19 note says this compensation varies widely by market and operator preference.
- Debt serviceLoan principal and interest on the build-out and equipment.
- Depreciation & taxesEquipment wears out, and income tax depends on your entity and situation.
This is also why EBITDA cannot be compared directly with the NRA’s 4.0% median pretax income for limited-service restaurants, which is measured after interest and depreciation. Ask your accountant to rebuild any EBITDA figure for your own case.
Building a restaurant KPI dashboard
One page, read the same day every week
A restaurant KPI dashboard is one page with the ten numbers, this week against the same week last year, and a note on anything that moved. If a restaurant KPI cannot change a decision you make this week, it belongs on the monthly report instead.
Most of the inputs come from three places: the point-of-sale system for sales, tickets and transactions, payroll for hours and labor cost, and a weekly inventory count for COGS and waste. Restaurant analytics software can pull these together, but the counts still have to be real.
| KPI | Formula | Source | Cadence |
|---|---|---|---|
| Gross sales | Total sales, by stream | POS | Daily |
| COGS % | (Opening inventory + purchases – closing inventory) / sales | Inventory count, invoices | Weekly |
| Labor cost % | Payroll, taxes & benefits / sales | Payroll | Weekly |
| Sales per labor hour | Sales / hours worked | POS, time clock | Daily |
| Average ticket | Sales / transactions, by stream | POS | Weekly |
| Meal plan repeat rate | Repeat customers / last week’s customers | Order system | Weekly |
| Grab-and-go waste | Discard cost / production cost | Waste log | Weekly |
| Catering share | Catering sales / gross sales | POS or invoices | Monthly |
| Occupancy % | Rent & lease charges / sales | Lease, P&L | Monthly |
| EBITDA | Sales – operating costs, before owner pay | P&L | Monthly |
For a Clean Eatz cafe, Item 7 lists a technology package of $8,700 to $12,000 and Item 6 a $638 monthly technology fee. Ask in validation which of these reports owners get from the system and which they build themselves.
Restaurant benchmarks from the FDD
Item 19 beside the industry
Public restaurant benchmarks come from surveys and public companies, and each defines its lines a little differently. An FDD adds a third reference point: the reported results of the system you are actually considering. For a healthy cafe franchise like Clean Eatz, that means the 2025 Item 19 cost lines.
The table sets the Item 19 cost averages beside the NRA’s 2024 limited-service medians and the 2025 results of two fast-casual chains.
| Clean Eatz Item 19, 2025 average | NRA limited-service median, 2024 | Chipotle 2025 | CAVA 2025 | |
|---|---|---|---|---|
| Food / COGS | 38.3% (COGS) | 32.4% (food & beverage) | 29.6% | 29.8% |
| Labor | 15.9% | 31.7% | 25.1% | 25.8% |
| Occupancy | 7.5% | Not in the NRA pages cited | 5.2% | 7.1% |
| Bottom line | 12.5% EBITDA before owner & manager salary | 4.0% pretax income | 25.4% restaurant level | 24.4% restaurant level |
In dollars, the 92 cafes reported average gross revenues of $1,030,285 in 2025, with COGS of $394,297, labor of $164,282, occupancy of $77,127, other operating costs of $266,267 and EBITDA of $128,312 before owner and manager salary. Median gross revenues were $962,325, the highest cafe reported $2,053,793 and the lowest $389,339.
*Financial performance representation. These figures are taken from Item 19 of the Clean Eatz Franchise Disclosure Document dated April 30, 2026, and reflect January 1 through December 31, 2025. They represent 92 franchised restaurants open at least eighteen months as of December 31, 2025 and operated by the same franchisee throughout the period. EBITDA is stated before owner and manager salary. These are historical results for existing locations. They are not a projection or guarantee of what you may earn. Your results may differ, and there is no assurance you will do as well. Written substantiation is available upon request. See Item 19 of the FDD for complete information.
Three cautions before you draw conclusions. COGS in a cafe that sells retail products can be broader than food cost. The published summary does not say whether the labor line includes a manager’s pay, and EBITDA is stated before owner and manager salary. Chipotle and CAVA run their own restaurants and pay no royalty, while a franchisee does.
To see how the five revenue streams, the 11am to 7pm day and the no-fryer kitchen fit together, read Inside a healthy cafe franchise model, then take these lines into your validation calls and your accountant’s review.
Sources
- 2026 State of the Restaurant Industry, National Restaurant Association, February 2026
- New Association report helps operators gauge their restaurant performance, National Restaurant Association, August 20, 2025
- Restaurant labor costs are well above historical averages, National Restaurant Association, August 27, 2025
- Labor costs and restaurant profitability in 2024, Restaurant Economic Insights, National Restaurant Association, October 8, 2025
- Restaurant operators kept food cost ratios in check in 2024, National Restaurant Association, September 10, 2025
- Average hourly earnings, food services and drinking places (CES7072200003), BLS Current Employment Statistics, 2025 to 2026
- Chipotle announces fourth quarter and full year 2025 results, Chipotle Mexican Grill, February 3, 2026
- CAVA Group reports fourth quarter and full year fiscal 2025 results, CAVA Group, February 24, 2026
- Investment & earnings (Item 6, Item 7 and Item 19 of the FDD dated April 30, 2026), Clean Eatz Franchising
- Why Clean Eatz, Clean Eatz Franchising
Common questions about restaurant key performance indicators
Short answers for busy owners
Restaurant key performance indicators are only useful when the definitions stay the same week to week. These answers use the formulas above.
Which restaurant KPIs matter most each week?
Weekly gross sales, labor cost percentage and cost of goods sold, because together they decide most of the margin. Add meal plan repeat rate and grab-and-go waste if your cafe sells prepared meals, since both move before the sales line does.
How often should you review restaurant analytics?
Check sales and labor hours daily, the full KPI set weekly and the P&L monthly. Once a year, set your results beside the FDD you bought on and ask what changed.
What is a good labor cost percentage for a cafe?
There is no single right number, because it depends on menu, hours and wages. As a reference, the NRA reported a 2024 median of 31.7% of sales for limited-service restaurants, and 30.0% among those that made a profit. Common targets such as “30%” are rules of thumb, not measured benchmarks.
Which KPIs should you ask about in validation?
Ask owners which numbers they review each week, what their labor and food cost look like in a slow month, and how they track meal plan retention. Clean Eatz calls validation Talk to Our Owners and says it does not screen who you speak with.