Most new restaurants survive their first year. Of the accommodation and food services establishments that opened in the year to March 2025, 85.3% were still operating in March 2026, according to the Bureau of Labor Statistics. Of those that opened in the year to March 2021, about 56% were still open five years later. Risk is real and front-loaded, but it looks nothing like the claim that 90% of restaurants fail in year one.
The 90% figure is best known from a 2003 American Express TV ad, and the company said in writing that it could not provide data to support it. Below is what the data measures, why restaurants close and what a franchise changes about those causes.
Key stats
- 85.3%new accommodation and food services establishments still open after 1 year, March 2026 (BLS)
- 56.3%still open after 5 years, group that opened by March 2021 (BLS)
- 57,936food service and drinking place locations that closed in the year to March 2023 (Census)
- 19.0%closing rate for restaurant and bar locations about one year old, 2023 (Census)
The short answer
About 15% of new food service and lodging establishments close within a year and about 44% within five, per BLS survival data for March 2026. The 90% first-year failure rate is a myth. No current federal source shows franchises failing less often, so judge a franchise by its model and its own Item 20 closure tables.
Restaurant failure rate at a glance
Four sources, four definitions
Any restaurant failure rate you hear quoted depends on who did the counting and what they called a failure. BLS follows groups of new establishments to see how many are still operating. Census counts closings among locations with paid employees. One well-known study counted every change of ownership, so a profitable sale scored the same as a shuttered dining room.
Read restaurant failure rate statistics with three questions in mind: is it locations or companies, is it survival or closings, and which group of openings is being followed?
- 85.3%One-year survival, accommodation & food servicesBLS Business Employment Dynamics, March 2026
- 56.3%Five-year survival, same sectorBLS Business Employment Dynamics, March 2026
- 9.0%Share of food service & drinking place locations that closed in a yearCensus BDS, year to March 2023
- 59.74%Three-year ownership turnover, Columbus, OhioParsa et al., data 1996 to 1999
| Statistic | Figure | What it counts | Source & year |
|---|---|---|---|
| One-year survival | 85.3% | New establishments still operating one year later, hotels included | BLS, opened by March 2025 |
| Five-year survival | 56.3% | Same measure, five years after opening | BLS, opened by March 2021 |
| Annual closing rate | 9.0% | Employer locations in NAICS 722 that closed during the year | Census BDS, 2023 |
| Closing rate at age 1 | 19.0% | NAICS 722 locations about one year old that closed | Census BDS, 2023 |
| First-year ownership turnover | 26.16% | Closings plus sales and transfers, one city | Parsa et al., data 1996 to 1999 |
| “90% fail in year one” | None | No dataset. An ad claim its sponsor could not support | Parsa et al., 2005 |
NAICS 722 covers food services and drinking places: restaurants, caterers, food trucks and bars. BLS survival figures cover the wider NAICS 72, which adds hotels. Neither agency’s survival or closing data separates franchised locations from independents.
What percentage of restaurants fail?
Fewer than the myth, more than you want
So what percentage of restaurants fail? On current federal data, about 15% of new food service and lodging establishments are gone within a year, about 44% within five and about 57% within ten. Each year the restaurant and bar sector also loses a share of its existing locations, young and old.
To see how many restaurants fail in a single year, the Census business dynamics statistics are the most detailed public count. In the 12 months to March 2023, 57,936 food service and drinking place locations closed and 72,052 opened, out of 650,891 at the end of the period. That is a closing rate of 9.0% and an opening rate of 11.2%, so the sector grew even as thousands of owners shut their doors.
What percentage of restaurants fail in the first year
About one in seven, by the BLS count
Asked what percentage of restaurants fail in the first year, the best current answer is about 15%. BLS tracked 57,149 accommodation and food services establishments that opened in the year to March 2025. By March 2026, 48,720 were still operating, or 85.3%, against 78.9% across all private industries.
Census data by location age gives a second view of how many restaurants fail in the first year. In 2023, restaurant and bar locations about one year old closed at a 19.0% rate, the highest of any age. From there it falls with each year of age, to 10.2% at age 5 and 5.9% for locations 26 years and older.
Closing rate by location age, food services & drinking places, 2023
Source: US Census Bureau, Business Dynamics Statistics 2023, NAICS 722 by establishment age. Closings in the year to March 2023 as a share of the average number of locations.
BLS follows one group of openings forward, while Census measures a single year of closings at every age, so the two figures differ. Both put the most risk in the first two years.
Restaurant survival rate after five years
Just over half are still open
On BLS data, the five-year restaurant survival rate is 56.3%: of the 43,571 accommodation and food services establishments that opened in the year to March 2021, 24,521 were operating in March 2026. That group opened during the pandemic. A group that opened a year earlier reached 59.3% at five years, so a fair range is 56% to 59%.
| Still operating in March 2026 | All private industries | Accommodation & food services |
|---|---|---|
| After 1 year (opened by March 2025) | 78.9% | 85.3% |
| After 5 years (opened by March 2021) | 47.2% | 56.3% |
| After 10 years (opened by March 2016) | 34.2% | 42.9% |
Survival also gets easier with time. Of the establishments in that 2021 group still open after one year, 88.2% made it through year two, and by year five 91.1% of the prior year’s survivors stayed open.
Where the ninety percent myth came from
A TV ad, not a dataset
H.G. Parsa and colleagues documented the claim in “Why Restaurants Fail”, published in Cornell Hotel and Restaurant Administration Quarterly in 2005. In summer 2003, an American Express ad aired during an NBC reality series stated that 90% of restaurants fail in their first year. When asked for its data, American Express said in writing that it could not provide any.
Parsa’s team also tested the number. In their simulation, a 90% first-year failure rate would shrink a market of 1,500 restaurants to 254 within 20 years, the opposite of what markets do. Their own data, 2,439 licensed restaurant licenses in Columbus, Ohio from 1996 to 1999, showed 26.16% ownership turnover in the first year and 59.74% over three years.
Check the definition
Parsa counted any change of ownership as a failure, so a sale counts the same as a closing. Its 59.74% is a three-year figure. Quote it as one, and never as a first-year rate.
Restaurant closures & what drives them
A few pressures explain most of it
Restaurant closures run high every year, in good economies and bad. For food services and drinking places, the Census closing rate was 8.7% in the year to March 2019, rose to 11.7% in the pandemic year to March 2021, and was back to 9.0% by 2023. Over the long run it has come down: the same series shows 16.1% in 1978 and 11.0% in 2000.
Annual closing rate, food services & drinking places
Source: US Census Bureau, Business Dynamics Statistics 2023, NAICS 722. Each year runs from March to March, so 2021 covers March 2020 to March 2021.
Why do restaurants fail?
Owners name the same causes
Federal data counts closings but does not record why they happened. The best-known direct evidence on why do restaurants fail is the Parsa study’s interviews with 40 independent owners, 20 still operating and 20 who had closed or sold. Failed owners most often named owner and manager factors: attitudes, expectations, control, knowledge and skills. Close behind came the time and labor the business demanded, weak food-quality control or low perceived value, being undercapitalized or managing money poorly, and staff quality and turnover. An ill-defined concept was also on the list. Five failed owners said they closed when they were no longer willing to make the family sacrifices the hours required.
Thin margins & high fixed costs
A few cents of each sales dollar
In its 2026 State of the Restaurant Industry report, the National Restaurant Association puts median income before taxes at 4.0% of sales for limited-service restaurants in 2024 and 2.8% for full-service, down from 6% and 4% in 2019. In its February 2026 release, the association said 42% of operators reported their restaurant was not profitable in 2025, and 60% saw softer traffic.
Per $100,000 of sales at a median limited-service restaurant, food and nonalcoholic beverages ran about $32,400 (32.4%) in 2024 and wages and benefits about $31,700 (31.7%), against about $4,000 of pretax income. Separate medians do not sum to one income statement, but the scale is clear.
Rent, insurance and loan payments do not shrink in a slow month. On a few points of margin, a modest dip in sales can erase a year’s profit.
Location, concept & owner experience
Where you open, what you sell, who runs it
Location shows up directly in the data. In the Parsa study, ownership turnover by ZIP code tracked restaurant density with a correlation of .9919. Concept mattered too. Over three years, Mexican restaurants had the highest turnover in the study at 86.8%, while seafood restaurants had the lowest at 33.3%.
Parsa’s interviews found little difference in written strategy between owners who made it and those who did not, but a large gap in how clearly each could state the concept. Successful owners credited food quality, their own knowledge and drive, trained staff, capital and location. Every failed owner mentioned the time commitment the business demanded.
Restaurant success rate for franchises vs independents
A smaller gap than the pitch suggests
No federal agency publishes a restaurant success rate split by franchise status. What comparisons exist come from older academic studies, and they do not agree with each other.
| Ownership turnover, Columbus, Ohio | Chain units | Independents |
|---|---|---|
| Year 1 | 24.06% | 27.51% |
| Cumulative, year 2 | 42.68% | 47.13% |
| Cumulative, year 3 | 57.22% | 61.36% |
| Restaurants in the study | 956 | 1,483 |
In the Parsa data from 1996 to 1999, chain units turned over 4.14 percentage points less over three years. The abstract calls the gap marginal, though it was statistically significant. Every chain had at least three units and most independents had two or fewer, so scale may explain part of it.
An SBA-funded study pointed the other way. An SBA Office of Advocacy summary of Timothy Bates’s 1996 research followed small firms in all industries started in 1986 and 1987 through 1991. Of the non-corporate franchises, 61.9% survived, against 68.1% of independent startups, and the franchises averaged negative profits. Corporate franchised restaurants and hotels did better than corporate independents.
About “95% of franchises succeed”
No primary source supports a franchise success rate of 90% or 95%. In a 2000 Christian Science Monitor report, the International Franchise Association said a fair franchise versus independent comparison could not be done. A rate you may hear today, FRANdata’s historical unit success rate, expected at about 94.2% across all franchise sectors for 2025, is a lending-risk measure that counts some closed units as successes when the lender was likely repaid.
What franchise data can & cannot show
Item 20 is the brand’s own survival table
Every franchisor has to publish its own record. Under the FTC Franchise Rule, Item 20 of the Franchise Disclosure Document shows, state by state for the last three fiscal years, outlets opened, transferred, terminated, not renewed, reacquired by the franchisor and “ceased operations” for other reasons. It must also list franchisees who left the system in the last fiscal year, with contact details.
Item 20 cannot tell you why a unit closed or whether owners made money. Read it for the pattern: closings clustered in one state, a run of transfers, or a system shrinking while it sells new units.
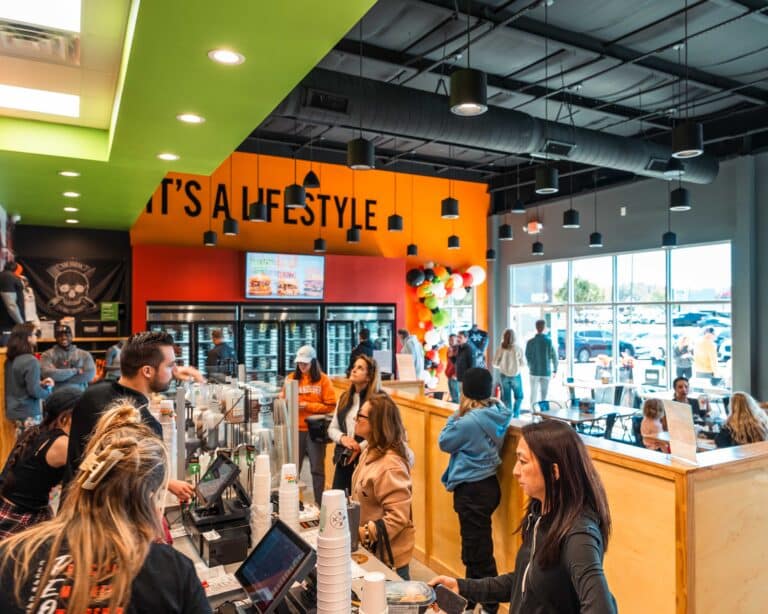
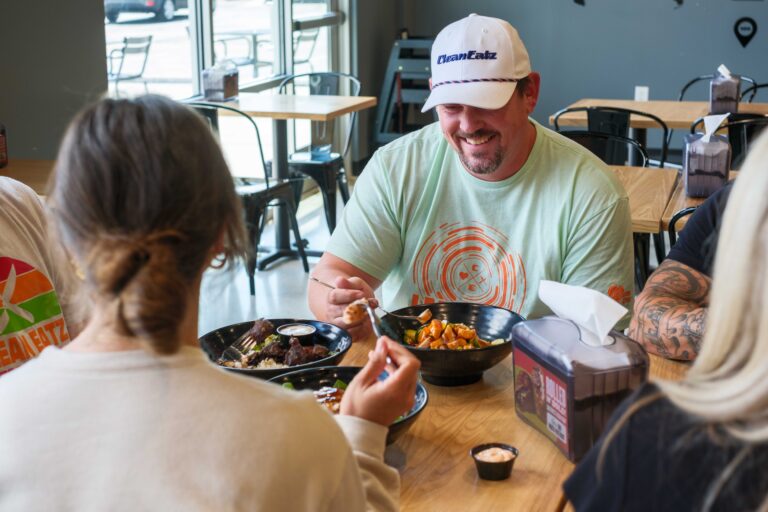
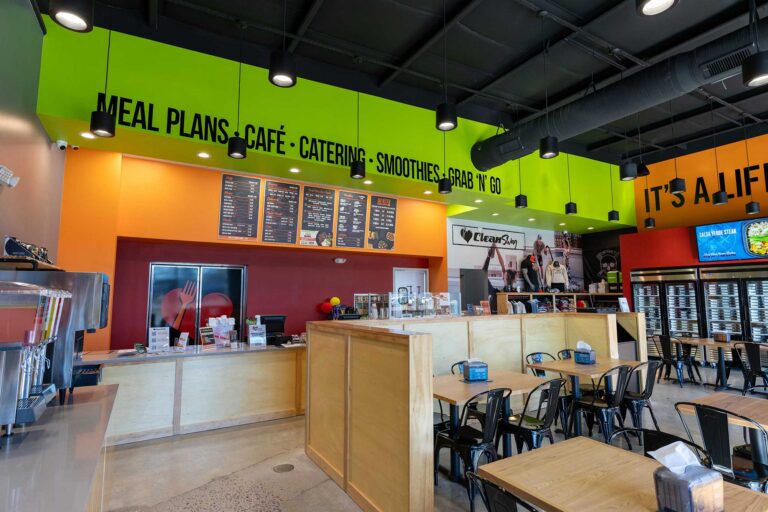
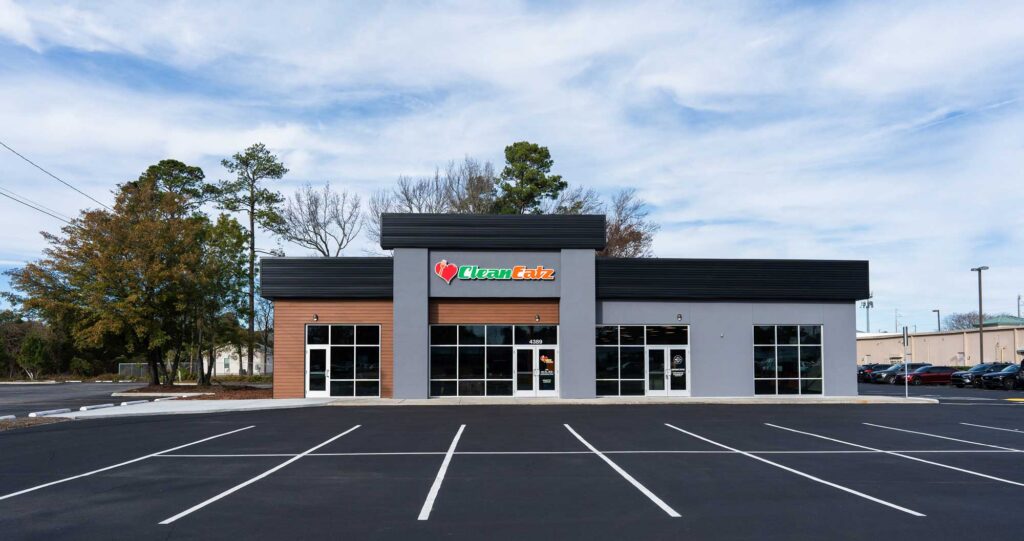
Clean Eatz is a working example. Its FDD dated April 30, 2026 states that of the 116 outlets open during fiscal 2025, 114 were franchised and 2 were company-owned or affiliated. Its Item 19 shows that results inside one system spread widely. In 2025, across 92 franchised cafes open at least 18 months, average gross revenues were $1,030,285 and the median was $962,325. At the top, one cafe reported $2,053,793. At the bottom, one reported $389,339, and the bottom quartile averaged $672,572.
These are gross revenues, not owner income. Clean Eatz publishes both ends on its investment & earnings page, and any brand you consider should too.
*Financial performance representation. These figures are taken from Item 19 of the Clean Eatz Franchise Disclosure Document dated April 30, 2026, and reflect January 1 through December 31, 2025. They represent 92 franchised restaurants open at least eighteen months as of December 31, 2025 and operated by the same franchisee throughout the period. EBITDA is stated before owner and manager salary. These are historical results for existing locations. They are not a projection or guarantee of what you may earn. Your results may differ, and there is no assurance you will do as well. Written substantiation is available upon request. See Item 19 of the FDD for complete information.
No survival table measures the people around you. Clean Eatz owners meet each year at a franchisee conference, which in 2025 was the In Your Corner conference. Ask current owners how much that network helped in their first two years, the stretch the data says is hardest.
What changes with a healthy franchise
Better inputs, not better odds
Nothing in the data above shows that a healthy franchise has a lower failure rate. What a franchise can change are the inputs the Parsa interviews linked to failure: concept, capital, hours and owner knowledge. Clean Eatz is a healthy franchise built differently on several of those points, and each one comes with a trade-off.
| Failure driver | What the Clean Eatz model sets | What stays on you |
|---|---|---|
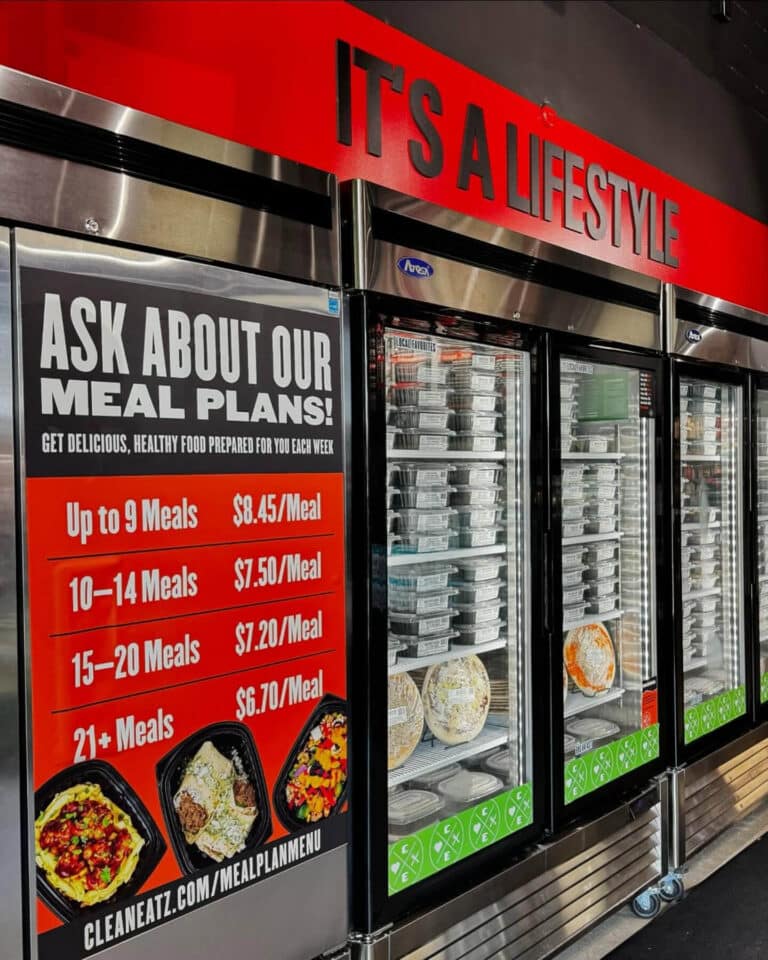
| Unclear concept | A set menu and operating standards across five revenue streams: Meal Plans, Grab-N-Go Meals, In-Store Cafe, Retail and Catering | Running five streams at once, weekly meal plan production included |
| Undercapitalized | Item 7 includes $20,000 to $40,000 of additional funds for the first 3 months. Single-unit buyers need $250,000 liquid | Holding reserves beyond the estimate if the opening runs slow |
| Hours & burnout | Roughly 11am to 7pm, no late nights, no fryers | Giving up late-night sales. Owners live within about an hour and run the cafe |
| Owner knowledge | 10 Days at HQ, On Demand Training, Grand Opening Support | Showing up and following the system |
| Location | Site selection with real estate and construction support | Your market and the lease you sign |
None of this makes the investment small. Item 7 estimates $307,500 to $733,500 to open, including the $49,500 franchise fee, and Clean Eatz says the model “isn’t designed as an absentee investment.”
A tested menu & supply chain
You do not invent the concept
An independent owner writes the menu, finds the suppliers and prices every plate, which is where an ill-defined concept starts. In a franchise those choices come from the system. Clean Eatz recipes, operating standards and daily checklists sit in its On Demand Training, and the Item 7 estimate budgets $10,000 to $18,000 for initial inventory bought from approved suppliers.
No fryers means a smaller, simpler equipment package, estimated at $60,200 to $156,500 in Item 7. Control is the trade-off: you sell the menu you are given and buy from the approved list, even when a local vendor is cheaper.
Training before opening day
Ten days at HQ, then on-site help
Young locations close at the highest rate, and failed owners in the Parsa interviews often pointed to gaps in their own knowledge and skills. Clean Eatz training starts with 10 Days at HQ in Wilmington, North Carolina, one-on-one rather than a group class, “covering operations, food, and the Clean Eatz system end to end.” Grand Opening Support puts the team on site through opening week, and the Ops & Marketing Team offers campaigns, tools and coaching after launch.
Training shortens the learning curve. It does not run the cafe.
Questions for current franchisees
Validation is the real test
The steps to own a Clean Eatz include Talk to Our Owners, known as validation, which the brand calls the most important step. It says it does not screen who you speak with. Read our franchisees in their own words, then call owners yourself with these questions:
- How long did your cafe take to open after signing, and what did the delay cost you?
- How much of your own cash did you use beyond the Item 7 estimate in the first year?
- When did the cafe first cover its costs, and what changed to get there?
- How many hours a week do you work in the cafe now, compared with year one?
- How long before the weekly rhythm of meal plan production felt routine?
- What does the bottom of the Item 19 range look like in practice, and why do some cafes land there?
- Who did you call when something broke in your first 90 days, and how fast did they answer?
- Would you sign again, and what would you do differently?
Then call former owners listed in Item 20. Introductory calls, validation and Discovery Day cost nothing, and financial commitment comes only when you sign a franchise agreement.
Sources & methodology
How these numbers were gathered
Survival rates are BLS Business Employment Dynamics Table 7, March 2026 rows, for NAICS 72 and all private industries, measured by establishment. Losses of 15%, 44% and 57% are 100 minus those rates.
Closings are Census Business Dynamics Statistics, 2023 release, NAICS 722. BDS counts a location while it has employees on payroll, years run March to March, and the closing rate divides closings by the average count at the start and end of the year. Census and BLS figures are rounded to one decimal.
Turnover data and owner interviews are from Parsa et al. (2005), the franchise comparison from the SBA summary of Bates (1996), and cost medians from NRA data for 2024. Clean Eatz figures are from its FDD dated April 30, 2026.
Sources
- Table 7, survival of private sector establishments by opening year, accommodation and food services, BLS Business Employment Dynamics, 2026
- Table 7, survival of private sector establishments by opening year, all industries, BLS Business Employment Dynamics, 2026
- Establishment age and survival FAQ, BLS Business Employment Dynamics
- Business Dynamics Statistics, US Census Bureau, 2023 release
- BDS 2023, 3-digit NAICS file (NAICS 722), US Census Bureau
- BDS 2023, 3-digit NAICS by establishment age file, US Census Bureau
- BDS codebook and glossary, 2023 release, US Census Bureau
- Food services and drinking places: NAICS 722, BLS Industries at a Glance
- Why restaurants fail, Parsa, Self, Njite & King, Cornell Hotel and Restaurant Administration Quarterly, 2005
- Survival patterns among franchise and nonfranchise firms started in 1986 and 1987 (Bates), SBA Office of Advocacy research summary 165, 1996
- The “real story” on failure rates?, Christian Science Monitor, April 24, 2000
- 2026 Franchising Economic Outlook, International Franchise Association & FRANdata, 2026
- 2026 State of the Restaurant Industry, National Restaurant Association, February 2026
- Persistent cost increases and enduring demand will shape the restaurant industry in 2026, National Restaurant Association, February 12, 2026
- Restaurant labor costs are well above historical averages, National Restaurant Association, August 27, 2025
- Restaurant operators kept food cost ratios in check in 2024, National Restaurant Association, September 10, 2025
- 16 CFR 436.5, Disclosure items (FTC Franchise Rule), Legal Information Institute
- Investment & earnings (Items 6, 7 and 19 of the FDD dated April 30, 2026), Clean Eatz Franchising
Restaurant failure rate FAQ
Quick answers
How many restaurants fail in the first year?
About 15% of new food service and lodging establishments close within their first year. BLS found 85.3% of those that opened in the year to March 2025 still operating in March 2026. Census data shows restaurant and bar locations about a year old closed at a 19.0% rate in 2023, the highest of any age.
Is the failure rate lower for franchises?
No current federal data answers that, because BLS and Census do not separate franchised locations. A 2005 study of 1996 to 1999 Columbus, Ohio data found slightly lower three-year turnover for chain units, 57.22% against 61.36%. An SBA-funded study of firms started in 1986 and 1987 found small non-corporate franchises survived less often than independents. Read each brand’s Item 20 instead.
What is the most common reason restaurants close?
No national dataset records reasons for closing. In one study’s interviews, failed owners pointed first to owner and manager shortcomings, then to the time and labor the business demands, weak quality control and short capital. Thin margins, a median 4.0% pretax for limited-service restaurants in 2024, leave little room for any of them.